
Table of Contents
In the fast-paced world of business, the ability to gather and interpret data is crucial for success. Data aggregation in Business Intelligence (BI) serves as the cornerstone for organizations seeking to extract meaningful insights from vast data sources. By harnessing the power of BI tools like Power BI, companies can transform raw data into actionable intelligence, fostering informed decision-making and strategic planning. This article delves into the role of data aggregation in BI and explores how it can be leveraged to unlock insights that drive business growth and competitive advantage.
Key Takeaways
- Data aggregation is a strategic function in BI that enhances decision-making by providing a consolidated view of information.
- Intelligent Insights in Power BI enable the identification of opportunities, risk minimization, and process optimization.
- Visual representations in BI, such as graphs and charts, translate complex data into strategic business insights.
- AI-driven features in Power BI, like predictive analytics and anomaly detection, reveal patterns and trends for informed decisions.
- A case study demonstrated a 22% sales increase through the application of Quantzig’s BI analytics solutions, highlighting the tangible benefits of data-driven strategies.
The Strategic Role of Data Aggregation in Business Intelligence

Understanding the Basics of Data Aggregation
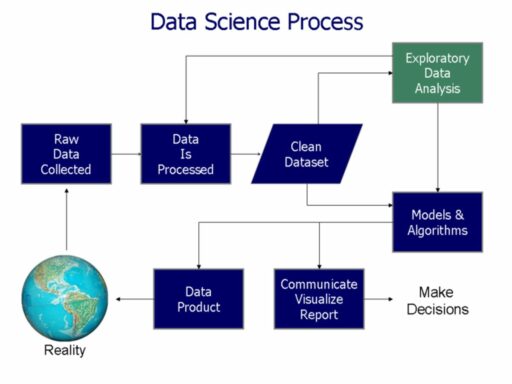
At the heart of business intelligence lies the critical process of data aggregation. This involves the collection and consolidation of data from various sources to form a cohesive, comprehensive dataset. Data aggregation is fundamental to generating actionable insights that drive strategic business decisions.
Data aggregation can be broken down into several key steps:
- Data Collection: Gathering raw data from multiple sources.
- Data Cleaning: Ensuring the accuracy and consistency of data.
- Data Integration: Combining data from disparate sources.
- Data Analysis: Applying statistical techniques to interpret data.
- Insight Generation: Translating data findings into business strategies.
By mastering these steps, organizations can transform raw data into a strategic asset, enhancing their market position and operational efficiency. The expertise in data science is crucial for achieving significant market results, as it encompasses a range of skills from IT knowledge to sector experience.
However, businesses often face challenges such as inadequate data insights due to reliance on third-party data sources. Addressing these challenges requires a robust framework for data management and the ability to analyze data effectively using tools like Power BI. With the right approach, data aggregation becomes a powerful lever for business growth and competitive advantage.
Enhancing Decision-Making with Aggregated Data
In the fast-paced world of business, aggregated data serves as a cornerstone for insightful decision-making. By synthesizing information from various sources, companies can gain a holistic view of their operations, customer behavior, and market trends. This comprehensive perspective is crucial for strategic planning and can lead to significant competitive advantages.
Aggregated data not only streamlines the decision-making process but also ensures that the insights derived are based on a complete and accurate dataset.
The following table illustrates a simplified example of how aggregated data can enhance decision-making in a retail business context:
| Metric | Before Aggregation | After Aggregation |
|---|---|---|
| Average Customer Spend | $45 | $60 |
| Quarterly Sales Growth | 3% | 5% |
| Customer Retention Rate | 75% | 85% |
By leveraging tools like Power BI, organizations can democratize data access, allowing teams to make informed, data-driven decisions. Advanced analytics and predictive modeling further refine the decision-making process, enabling businesses to anticipate future trends and prepare accordingly.
Case Study: Sales Increase through Strategic Data Use
In the realm of business intelligence, the strategic use of data aggregation can lead to transformative outcomes. A case in point is the success story of a multinational consumer goods company that, through meticulous data collection and cleansing, achieved a significant sales boost. The company faced challenges in tracking the performance of their products across various e-commerce platforms, which was impeding their revenue growth.
By partnering with Quantzig, the company developed a robust data-gathering framework and created interactive dashboards tailored to their needs. These dashboards provided a granular view of key performance indicators, such as pricing, discounts, positioning, and stock availability. The result was a remarkable 22% increase in sales, underscoring the impact of data-driven decision-making.
The power of data aggregation in business intelligence is evident in its ability to transform raw data into actionable insights. It enables companies to extract, analyze, and visualize data, leading to informed strategic planning and decision-making.
The table below summarizes the approach and outcomes of this strategic data use:
| Process Step | Description |
|---|---|
| Data Collection and Cleansing | Rigorous collection and cleansing of pertinent information. |
| Interactive Dashboard Development | Creation of dashboards for in-depth KPI analysis. |
| Data-Driven Decision-Making | Leveraged insights to drive a 22% increase in sales. |
Harnessing Intelligent Insights for Competitive Advantage

Leveraging AI-Driven Visualizations and Analytics
The integration of advanced AI and machine learning into business intelligence tools like Power BI is revolutionizing the way companies interpret and utilize their data. With AI’s ability to offer predictive analytics, automated data preparation, and personalized insights, businesses are now equipped to anticipate market trends and make proactive decisions.
- Predictive Analytics: AI algorithms analyze historical data to forecast future outcomes, aiding in strategic planning.
- Automated Data Preparation: AI streamlines the time-consuming tasks of data cleaning and transformation, freeing analysts to focus on insights.
- Personalized Visualizations: AI tailors reports and visualizations to the specific needs and preferences of users, enhancing the decision-making process.
The future of business intelligence is inextricably linked with AI, as it provides a competitive edge by transforming raw data into strategic insights. The ability to harness real-time data and convert it into actionable intelligence is a game-changer for businesses striving for operational excellence and market leadership.
Identifying Patterns and Trends with Predictive Analytics
Predictive analytics harnesses historical data and advanced algorithms to forecast future trends and behaviors, transforming raw data into actionable insights. By identifying patterns and relationships in data, businesses can proactively address customer needs, enhance satisfaction, and improve retention.
Predictive analytics is not just about data analysis; it’s a strategic tool for staying ahead of market dynamics and customer expectations.
For instance, predictive analytics can pinpoint potential ‘churners’—customers likely to leave—allowing businesses to implement targeted retention strategies. Here’s a simplified process:
- Collect and clean customer data.
- Analyze historical behavior and transactions.
- Identify at-risk customer segments.
- Develop and deploy retention campaigns.
Moreover, integrating predictive models into CRM systems enables real-time, personalized customer interactions, crucial for maintaining a competitive edge.
Realizing Business Potential with Anomaly Detection
Anomaly detection stands as a sentinel in the realm of Business Intelligence, safeguarding against irregularities that could signify critical issues such as fraud or customer churn. By leveraging predictive analytics, businesses can take proactive measures to retain their customers and address potential issues before they escalate.
Early identification of at-risk customers is a crucial aspect of customer retention. Utilizing predictive analytics allows for the proactive identification of customers likely to disengage, enabling timely and targeted interventions.
The table below illustrates the impact of anomaly detection on customer retention rates:
| Quarter | At-Risk Customers Identified | Customers Retained After Intervention |
|---|---|---|
| Q1 | 150 | 135 |
| Q2 | 200 | 180 |
| Q3 | 250 | 225 |
| Q4 | 300 | 270 |
By analyzing data points such as customer behavior, purchase history, and interaction patterns, businesses can not only predict but also prevent customer attrition. This strategic use of data ensures that resources are allocated effectively, resulting in improved customer retention rates and overall business health.
Optimizing Operations with Business Intelligence Analytics

Improving E-commerce Performance through BI Tools
In the competitive landscape of e-commerce, Business Intelligence (BI) tools are pivotal in transforming raw data into actionable insights. These tools enable businesses to understand customer behavior, optimize inventory, and enhance user experience. For instance, a BI solution can gather and evaluate consumer behavior and feedback data, including complaints, delayed shipments, and returns, which are crucial for e-commerce success.
The impact of BI tools on e-commerce performance is quantifiable. A case in point is Quantzig’s analytics-driven approach that delivered a 22% increase in sales for a client by leveraging interactive dashboards for data-driven decisions. The table below showcases the areas of improvement and the corresponding outcomes:
| Area of Improvement | Outcome |
|---|---|
| Customer Experience | Enhanced |
| Inventory Management | Optimized |
| Sales Performance | Increased |
By systematically analyzing customer interactions and sales data, e-commerce businesses can identify patterns that lead to improved strategies and operational excellence.
Adopting BI tools is not just about technology; it’s about embracing a culture that values data-driven decision-making. This approach ensures that every decision is backed by solid data, leading to better outcomes and a stronger competitive edge.
Streamlining Operational Workflows
In the realm of business intelligence, operational workflows are the arteries through which the lifeblood of data flows. Streamlining these processes is crucial for maintaining the health and efficiency of a business. For instance, a streamlined customer onboarding process not only enhances security but also significantly improves the customer experience.
- Enhanced security and fraud prevention
- Improved efficiency and accuracy
- Seamless customer experience
These benefits are not just theoretical; they manifest in tangible improvements across various business functions. Integration with existing systems is key to ensure a smooth migration process, minimizing any negative impact on operations and customer satisfaction.
By focusing on streamlining operational workflows, businesses can unlock a level of agility and responsiveness that is essential in today’s fast-paced market.
Achieving Operational Excellence with Data-Driven Strategies
Operational excellence is not a destination but a journey that requires continuous improvement and adaptation. Business intelligence plays a crucial role in driving operational excellence by providing organizations with valuable insights and data-driven decision-making capabilities. By leveraging business analytics solutions, companies can harness a comprehensive suite of tools to derive actionable insights from extensive datasets.
To create a data-driven strategy, it is essential to know the data well. Exploring different techniques for Data Analysis within Power BI is an important skill for data professionals.
The table below outlines the key goals and objectives of implementing predictive analytics to achieve operational excellence:
| Goal/Objective | Description |
|---|---|
| Effective Communication | Ensuring that insights and strategies are clearly conveyed to all stakeholders. |
| Training Programs | Developing skills and knowledge to utilize BI tools effectively. |
| Culture of Data-Driven Decision-Making | Fostering an environment where data guides strategic decisions. |
| Ongoing Support and Leadership | Providing the necessary resources and guidance for successful analytics adoption. |
By addressing data quality and availability issues, organizations can improve the reliability and effectiveness of their strategies. This, coupled with a strong alignment and change management, paves the way for a transformative journey towards operational excellence.
Communicating Insights: The Art of Data Visualization

Building Effective Reports and Dashboards
In the realm of Business Intelligence, the creation of reports and dashboards is a critical step in communicating insights effectively. These tools serve as the visual voice of data analytics, transforming complex datasets into clear and actionable information.
To achieve this, a variety of visual elements can be employed, each tailored to present data in the most intuitive way possible. For instance:
- Pie charts to represent parts of a whole
- Gauge charts for performance metrics
- Bar and column charts for comparisons
- Ribbon charts to show ranking changes over time
The goal is to craft a narrative that resonates with the audience, ensuring that the key messages are not only seen but understood.
It’s essential to link data from multiple sources, such as Excel spreadsheets, on-site data warehouses, and cloud-based storages. This convergence of data paves the way for a comprehensive view of business performance, leading to informed decision-making. Personalization plays a significant role as well, with customizable dashboards catering to individual user needs, enhancing both efficiency and user satisfaction.
The Importance of Visual Appeal in BI Reporting
In the realm of Business Intelligence (BI), the visual appeal of reports is not just about aesthetics; it’s a critical factor in the effectiveness of data communication. Bold visuals and a well-organized layout can significantly enhance the user’s ability to comprehend complex data sets. This is particularly true in Power BI, where the use of colors, shapes, and sizes can convey information more efficiently than text alone.
The right visual appeal in BI reporting can lead to quicker decision-making, as it allows stakeholders to grasp the insights at a glance without getting bogged down in numbers.
Consider the following table that highlights the benefits of intuitive data visualization in Power BI:
| Benefit | Description |
|---|---|
| Clarity | Simplifies complex data into clear visuals. |
| Engagement | Encourages interaction with the data. |
| Efficiency | Speeds up the process of data analysis. |
| Retention | Aids in the memory of key facts and figures. |
By prioritizing visual appeal in BI reporting, organizations can ensure that their data not only informs but also engages and persuades its audience.
Best Practices for Data Presentation in Power BI
In the realm of Power BI, mastering data presentation is crucial for conveying insights effectively. Personalized visualizations and reports are at the forefront, catering to individual user needs and enhancing the decision-making process.
Effective presentation hinges on the ability to distill complex data into clear, actionable insights. Power BI’s rich visualization tools enable this transformation, but it’s the thoughtful application of these tools that makes the difference. Here are some best practices:
- Utilize a variety of charts and graphs to cater to different data types and user preferences.
- Keep dashboards uncluttered by focusing on key performance indicators.
- Employ consistent design elements to maintain clarity across reports.
Embrace the art of simplicity in your visual stories. The goal is to make data comprehensible at a glance without sacrificing depth of insight.
Remember, the ultimate aim is to create interactive reports that not only inform but also engage the audience. With Power BI’s customization and extensibility, the possibilities are vast, yet the best practices revolve around the user experience and the clarity of the message conveyed.
Empowering Teams with Business Intelligence Best Practices

Fostering a Data-Driven Culture
Creating a data-driven culture within an organization is a transformative process that requires commitment at all levels. It begins with leadership setting the tone, emphasizing the importance of data in strategic decision-making, and permeates through every department and team member.
- Establish clear goals and objectives for data use
- Provide ongoing training and support
- Implement change management strategies
By investing in data quality and building a robust infrastructure, companies can ensure the integrity and reliability of their data, which is the cornerstone of effective business intelligence. Power BI, as a facilitator of democratized data analytics, plays a crucial role in this transformation by making data insights accessible to all users, regardless of technical expertise.
Embracing a data-driven culture is not just about having the right tools; it’s about nurturing an environment where data is valued as a critical asset for growth and innovation.
Training and Development for BI Proficiency
In the realm of Business Intelligence (BI), proficiency is not just about understanding the tools; it’s about mastering the strategic application of data for organizational growth. Training programs must therefore encompass a broad range of skills, from data analytics to the creation of actionable insights.
To ensure that teams are well-equipped, a structured approach to BI training is essential. Below is a list of key skills that should be included in a Power BI training curriculum:
- Data analytics and interpretation
- KPI identification and tracking
- Data warehousing principles
- Data modeling and transformation
- Report creation and visualization techniques
By investing in comprehensive training, organizations empower their employees to leverage BI tools effectively, translating complex data into strategic decisions that drive success.
As the landscape of data continues to evolve, with advancements in cloud and hybrid solutions, training must also adapt. Staying current with the latest Power BI skills is crucial for maintaining a competitive edge in a data-driven market.
Maximizing ROI with Power BI Implementation
To maximize return on investment (ROI) with Power BI, businesses must leverage its full suite of capabilities. Power BI’s intuitive data visualization tools transform complex datasets into actionable insights, driving informed decision-making. Seamless integration with existing systems ensures that Power BI complements and enhances the business’s analytical ecosystem.
The key to unlocking Power BI’s potential lies in its customizable features. Personalized dashboards and reports cater to individual user needs, streamlining the path to relevant data. This personalization not only boosts efficiency but also user satisfaction, as shown in the table below:
| Feature | Impact on ROI |
|---|---|
| Intuitive Visualizations | Increases user adoption |
| Seamless Integration | Reduces training time |
| Personalized Reports | Enhances decision-making |
By focusing on these core features, organizations can ensure that their Power BI implementation is not just a tool, but a strategic asset.
Collaboration is another cornerstone of Power BI’s value proposition. Real-time collaborative features foster a culture of data-driven decision-making, aligning departments and empowering teams. When every member of the organization can access and understand the data, the collective intelligence grows, leading to innovative solutions and a competitive edge.
Conclusion
In the landscape of modern business, the integration of Business Intelligence (BI) solutions like Power BI has proven to be a game-changer. The ability to aggregate data and transform it into actionable insights is not just a competitive advantage but a necessity for informed decision-making and strategic planning. As we have seen, the use of Intelligent Insights and advanced analytics features within Power BI enables businesses to detect patterns, understand trends, and make data-driven decisions that can lead to significant outcomes such as a 22% increase in sales. The case studies and examples discussed underscore the transformative potential of BI tools in optimizing operations, understanding customer behavior, and ultimately driving growth. As organizations continue to navigate the complexities of the digital era, embracing the power of data aggregation and business intelligence analytics will be pivotal in unlocking insights that propel them towards success.
Frequently Asked Questions
What is the significance of data aggregation in business intelligence?
Data aggregation is crucial in business intelligence as it consolidates data from various sources into a summarized format, enabling businesses to accelerate decision-making, enhance confidence in their choices, and identify opportunities, minimize risks, and optimize processes.
How can Power BI transform the way businesses understand their data?
Power BI transforms business data understanding by providing advanced analytics features like AI-driven visualizations, anomaly detection, and predictive analytics. These help users uncover subtle patterns and trends, leading to more informed strategic decisions.
What are the benefits of using visually appealing BI reports and dashboards?
Visually appealing BI reports and dashboards facilitate easier comprehension of data, enabling teams to make strategic choices quickly. They help in communicating complex data in a straightforward manner, which is essential for effective decision-making.
What kind of impact can analytics-driven business intelligence solutions have on sales?
Analytics-driven BI solutions can have a significant impact on sales, as seen in a case study where the use of interactive dashboards led to a 22% increase in sales by enabling data-driven decisions and optimizing e-commerce performance.
Why is fostering a data-driven culture important within an organization?
Fostering a data-driven culture is important as it ensures that all levels of the organization make decisions based on data analysis and insights. This approach leads to better strategic planning, operational efficiency, and competitive advantage.
How does Power BI aid in operational excellence and strategic planning?
Power BI aids in operational excellence by enabling users to analyze data for forecasting trends and making informed decisions. It supports strategic planning by providing tools to create data-driven strategies and visualize insights for effective communication.